OfferGet 10% off on Dissertation, Assignments, Essays, Thesis
The term carbon emission also referred to as carbon footprint is defined as the amount of greenhouse gas emission as a result of individual and organizational activities measured in carbon dioxide equivalent.
Measuring the exact set of carbon footprint is difficult in most cases due to improper information and data regarding the complex interactions between the contributing factors, most importantly the impact on natural procedure in discharging carbon dioxide.
According to Wright, Kemp and Williams (2011) carbon footprint is the quantity of carbon dioxide (CO2) and methane (CH4) emission of a well-defined population, event or structure taking into account important sources, storage and sinks within the spatial and temporal boundary of the population, structure or event. It is estimated as carbon dioxide base on the 100 year global potential (GWP 100).
The emission of greenhouse gases can occur due to clearing of the environment and the production of consumables, construction, transportation and other activities.
According to (Wright, Kemp, Williams, 2011) in the global perspective greenhouse gas emission due to human activity constitutes carbon dioxide (CO2), methane (CH4), nitrous oxide (N2O), and fluorinated gases (F – gases). The carbon dioxide (CO2) is the major contributor to greenhouse gas emission accounting for 65 percent, it constitutes fossil fuel and land usage imposed through land clearance, agricultural land clearing, cultivation, soil degradation, and deforestation. methane (CH4) accounts for 16 percent of the emission through waste disposal, agricultural events and the use of energy. nitrous oxide (N2O) accounts for 6 percent of the emission through the use of fertilizers for agricultural activities. fluorinated gases (F – gases) accounts percent of the emission through production of consumables.
Global emission can also be categorized based on sectors of the economy. Production of electricity and heat accounts for 25 percent of greenhouse gas emission through the use of electricity, coal burning, oil and natural gas. The industrial sector accounts for 21 percent of greenhouse gas emission through chemical and raw material emission. Agriculture, forestry, and other land use accounts for 24 percent of global greenhouse gas emission through cultivation and harvest of agricultural products and deforestation. Transportation accounts for 14 percent of greenhouse gas emission through rail, road and marine means of transportation. Building accounts for 6 percent while other energy sources accounts for 10 percent of greenhouse gas emission globally (Jones, Christopher; Kammen, Daniel 2011).
Chevron (2011) highlighted that the G8 countries in 2007 have decided to target and reduce the global emission by 50 percent by the year 2050, this threshold is set to allow developing countries to grow at a stable rate in the future, while Britain’s climate watchdog has suggested 80 percent cut in global emission by 2050. The Copenhang summit of 2009 highlighted that greenhouse gas emission should start reducing by 3 percent if the 2050 threshold is set to be achieved.
As we are currently passing through the Fourth phase of industrial revolution, urbanization is continuously spreading globally and 70 percent of the global population is expected to be living in the cities by 2030, there is immense need to develop various alternatives for clean and cost effective energy generation to address the current trend of greenhouse gas emission globally. The current scenario reveals that buildings contribute up to 3 percent of global greenhouse gas emission (Alex Molinaroli, 2016).
Recently, it is discovered that we can also get renewable energy from the earth; it was discovered that the temperature on the ground of the earth can reach 9,0000F which can be used as a source of energy on the earth surface, referred to as geothermal energy.
Organisational culture also plays an important role in shaping relevant ideologies. Wilson (2014) mentioned that in many organisations culture is driven by shared values and beliefs. The article published by BBC stated that majority of the top management professionals were aware of their unethical measures but did not share it with middle or lower management (BBC, 2017). This means that the culture was mainly driven by a hierarchy approach where the top management took all the decision rather than seeking views and opinions of others especially stakeholders. The article published in New York Times also suggested that the organisational culture lacked ethical approach and measures that made the company involve in unethical acts by cheating their stakeholders (Ewing, 2017). Luthans and Doh Jonathon (2015) further added that organisational culture in the form of leadership; organisational climate, strategies, and HR policies can lead to favourable or unfavorable policies at workplace.
However, in regards to the Volkswagen, the report published in CNBC revealed that a number of board members were aware of the scandal but did not blew the whistle by supporting the unethical act (CNBC, 2017). This shows that the organisational culture was driven by strategies that defined irresponsibility and unethical measures to an extent. All the media articles further revealed that the diesel emission scandal was a thoughtful choice by the key members of the company. The culture of facilitating unethical strategies was well supported by the top management that affected the image and reputation of the company in a critical manner. Overall, it can be said that if Volkswagen had favoured an ethical and transparent culture, things would have been different in terms of highlighting the usefulness and credibility of their markets in global markets.
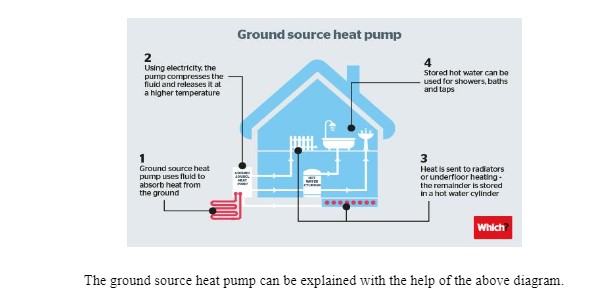
The application model of the geothermal heat system is said to work with the ground temperature which can be ideally used for heating and cooling system. The component of the geothermal heat system encompasses heat pump, air blower and heat exchanger; the air delivery forces the conditioned air into living area while the condensing component houses the refrigerative system, and the heat exchanger exchanges heat from the ground to the building. The earth temperature ranges between 450F to 750F depending on the latitude. Interestingly, the temperature is higher than the air during winter and lesser than the air during summer.
Implementation of the ground source heat pump system is growing fast with an annual increase of 10 percent as per global index. The growth rate of the system is equivalent in over 30 different countries. It was gauged in the year 2005 that the world installed capacity of the pumps stood at an average of 15,384 MWth capacity; even though there are a lot of countries that have very few or even no installation of the ground source heat pump (GSHP, hence forth) system.
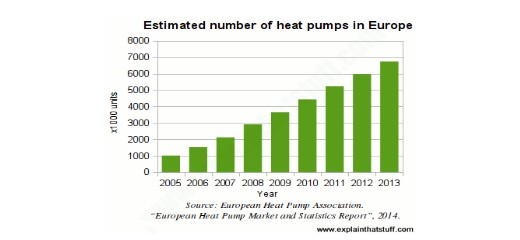
The above chart shows the estimated number of heat pumps in Europe, it is evident from the graph that the rate of heat pump installation is increasing at a steady rate over the years.
The growing demand for cost effective and efficient conditioning system from both household and business is triggered due to the factors such as volatile oil price, reduction in electricity bill, favorable incentives from the government and with the aim of reducing greenhouse emission for a better environment. UK has implemented the renewable heat incentive program which will favor commercial buildings for 20 years.
Geothermal heat pump market is forecasted to grow at an average rate of eight percent due to affordability and reliability. The size of the market in US in the year 2016 was valued at over 20 billion, the product demand will be boosted in the country due to its availability in constant shallow ground temperature, and the system will cut energy consumption by 44 percent in relation to other available conventional conditioning systems (Science Buddies Staff, 2017).
In china, geothermal heat pump market is expected to reduce the current environmental pollution, the Chinese government in 2016 announce it plan to increase energy consumption through geothermal energy to 72.1 million ton of coal equivalent by 2020 (The Geothermal Education Office, 2008).
Antics, Bertani, and Sanner (2013) assert that in Europe, Germany dominated the market for geothermal heat pump market accounting for 15 percent of the market share, the German government in 2016 announce it plan to invest over 250 billion USD on infrastructure. Increase spending from both public and private sectors will stimulate growth into the market.
The world heat pump market is estimated at 6,022 USD in 2012, based on the top ten rankings Japan and China are at top least with 2,398 and 1,177 USD respectively while Italy and Finland are at the lower bottom of the ranking with 107 and 105.9 USD respectively, others in the top ten ranking are Germany, France, Sweden, Switzerland, Austria, and Australia. Europe account for 38 percent of the market size, while Asia and Asia pacific accounts for 61.3 and 0.7 percent respectively.
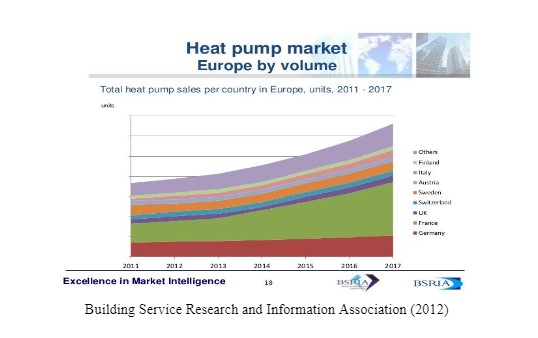
The total heat pump by country in Europe from 2011 to 2017 is shown in the graph above. Germany and France have the largest total heat pump in the region.
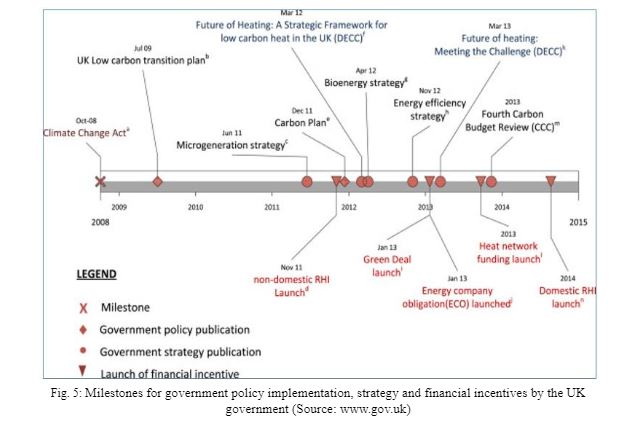
The milestone, government policy, strategy and financial incentives by the UK government are highlighted. The year 2008 serves as a milestone with the enactment of climate change act, in July 2009 the government came up with low carbon transaction plan while government strategy of micro generation was launched in 2011 and the non-domestic RHI was launch same year. Government incentives include Green deal, Energy Company Obligation (ECO), heat network funding, and domestic RHI in the year 2013, 2014 and 2015 respectively while government strategy bioenergy strategy, energy efficiency strategy, and future of heating: meeting the challenges, and fourth carbon budget review.
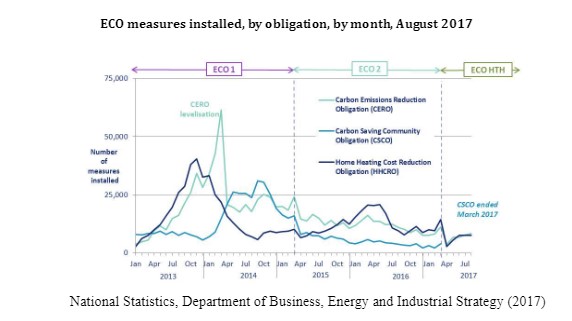
The Energy Company Obligation (ECO) from 2013 to 2017 is presented in the above graph, the first phase of the plan ECO 1 is launched in 2013 and covers a period of first quarter of 2013 to the first quarter of 2015, both carbon emission reduction obligation (CERO), carbon saving community obligation (CSCO) and home heating cost reduction obligation (HHCRO) reach their peak in ECO 1 while HHCRO started increasing in ECO 2 after its decline in ECO 1
ECO measures by main fuel type of property, by quarter, up to end June 2017
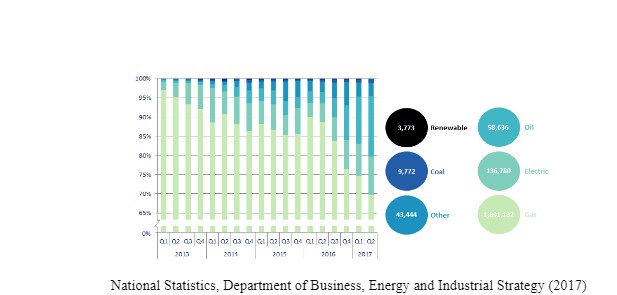
National Statistics, Department of Business, Energy and Industrial Strategy (2017)
The graph presents the ECO measures by fuel property from 2013 to 2017 second quarters. The main fuel type property used for conditioning are renewable, coal, oil, electricity, gas and other sources of energy, from first quarter of 2013 to first quarter of 2015 gas and coal are the main source while from the first quarter of 2016 renewable energy started playing a role in the ECO measures.
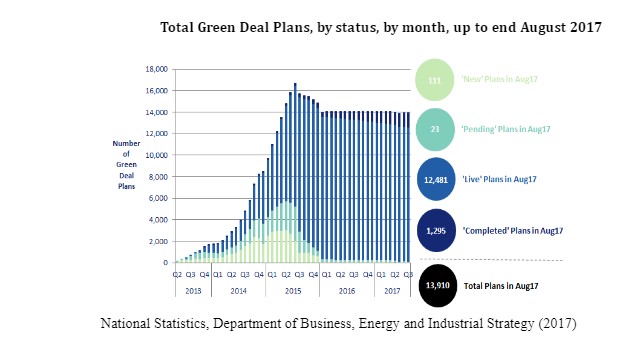
The status of green deal plans from 3013 to august 2013 is presented in the graph above, the total plan estimate at august 2017 are 13,910 out of which only 1,295 are completed, a total of 111 new plans were introduce in same time, live plans as at same time is 12,481 and the tally of pending plans is 23.
Proportion of the 1 million homes insulated target achieved, up to end of July 2017
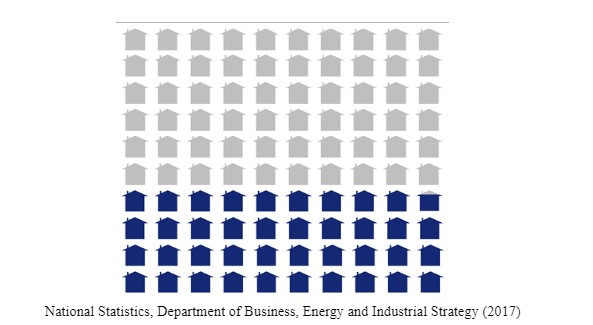
Each home represents 10,000 properties (blue = insulated, grey = to be insulated)
Proportion of the 1 million homes insulated target achieved is presented up to end of July 2017, the each blue sign indicates 10,000 properties insulated while grey indicates 10,000 property to be installed, and there is a wide deficit in the number of properties to be insulated.
ECO Measures by Measure Type, Up to August 2017
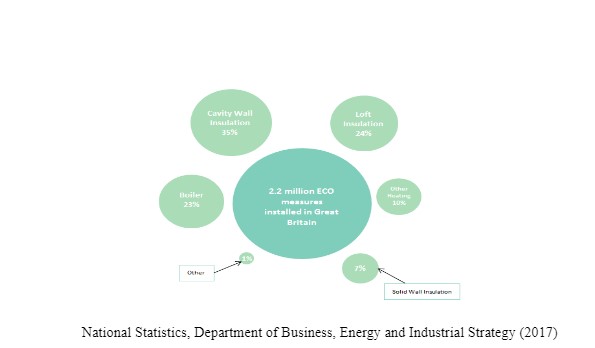
National Statistics, Department of Business, Energy and Industrial Strategy (2017)
The table above presents the ECO measures by type of measure as the measuring factor. As observed cavity wall insulation takes overall 35 percent occupancy, loft insulation takes 24 percent, boiler takes 23 percent, and other heating takes 10 percent, solid wall insulation takes 7 percent, while others take 1 percent. The total ECO mesures installed in UK is 2.2 million.
ECO measures by region, for the period of June 2017
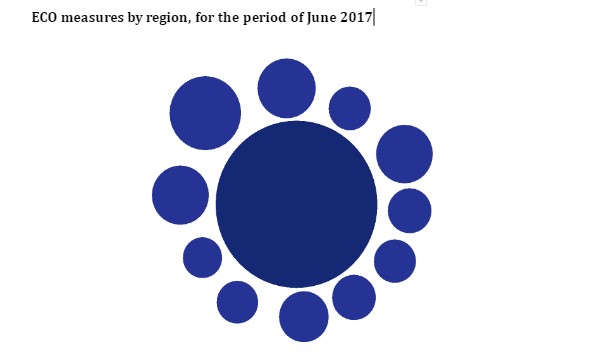
National Statistics, Department of Business, Energy and Industrial Strategy (2017)
Regional measures is presented in the chart above, out of 2.1 million ECO installations in UK North West have 19 percent occupancy, Scotland have 12 percent, north east 6 percent, Yorkshire and the Humber 12 percent, east midland 7 percent, wales 5 percent and London 7 percent.
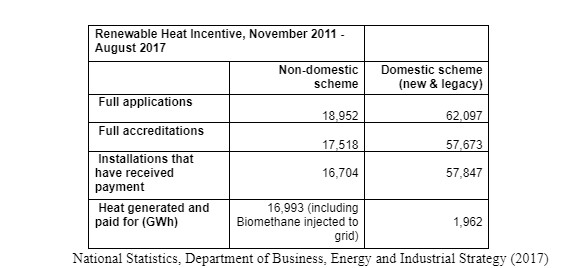
The table above presents the number of applications, accreditations and installations of incentives for domestic and non-domestic scheme. From November 2011 to august 2017 the number of applications for non-domestic and domestic scheme is 18,952 and 62,097 respectively. While the accreditations are 17,518 for non-domestic and 57,673 for domestic scheme among which 1670 have received payment for installation in the non-domestic scheme and 57,847 for domestic have received the payment for installation, the heat generated and paid for non-domestic is 16,993 while domestic accounts for 1,962 GWh only.
It is discovered that we get renewable energy from the earth; the temperature on the ground of the earth can reach 9,0000F which can be used as a source of energy on the earth surface, referred to as geothermal energy. The world heat pump market is estimated at 6,022 USD in 2012, based on the top ten rankings currently, Japan and China are at top of list with 2,398 and 1,177 USD respectively while Italy and Finland are at the lower bottom of the ranking with 107 and 105.9 USD respectively.
An opportunity for potential investors is that the size of the market was valued at over 20 billion, and the demand for GSHP will be boosted due to the availability of shallow ground temperature and the reduction in energy consumption by 44 percent.
The total insulations in UK in 2015 have reach 22,000 while annual installation is expected to reach 2,000 to 3,000 indicating a deficit in the total insulations. A positive signal to potential investors is that the GSHP market is growing more in UK than some other European countries.
The total green deal plan in UK as at August 2017 are 13,910 which only 1,295 are completed, a total of 111 new plans were introduce in same time, live plans as at same time is 12,481 and the pending plans is 23.Out of the 1 million homes insulated target there is a very wide gap between the properties insulated and the properties to be insulated. Due to the above facts and figures we can conclude the market for GSHP in UK is still at the rudimentary stage, more investors and installers are needed into the market so as to meet the green deal target and the market is worth investing in
Alex Molinaroli (2016) From Paris to Dubai, How Can Cities be more Sustainable? He is participating in the World Economic Forum’s Annual Meeting in Davos. Chairman, President and CEO, Johnson Controls
Amis T and Loveridge F. (2014). Energy Piles and other Thermal Foundations for GSHP. REHVA Journal
Antics, M., Bertani, R. & Sanner, B. (2013): Summary of EGC 2013 Country Update Reports on Geothermal Energy in Europe. - Proc. EGC 2013, paper keynote-1, 18 p., Pisa
Bloomquist, R. Gordon, M (2009). Geothermal Heat Pumps, Four plus Decades of Experience, 2009
CCC, (2013a). Fourth Carbon Budget Review-part 2: The Cost-Effective Path to the 2050 Target. Committee on Climate Change.
CCC, (2013c). Meeting Carbon Budgets-2013 Progress Report to Parliament. Committee on Climate Change.
Chevron (2011). Geothermal: Harnessing Renewable Energy for Power Generation.
Conti P., Cei M., Razzano F., (2015) Geothermal Energy Use, Country Update for Italy - Proc. EGC 2016, Strasbourg
DECC, (2012d). The Energy Efficiency Strategy: The Energy Efficiency Opportunity in the UK. UK Department of Energy and Climate change.
DECC, (2013a). Domestic Renewable Heat Incentive: The First Step to Transforming the Way We Heat Our Homes. UK Department of Energy and Climate Change.
DECC, (2013b). The Future of Heating: Meeting the Challenge. UK Department of Energy and Climate Change.
DECC, (2013c). The Future of Heating: Meeting the challenge, Evidence Annex. UK Department of Energy and Climate Change.
DECC, (2013d). Micro generation Strategy Industry Action Plan. UK Department of Energy and Climate Change.
DECC, (2013g). Non-Domestic Renewable Heat Incentive (RHI). UK Department of Energy and Climate Change.
DECC, (2014). Heat Networks Delivery Unit. UK Department of Energy and Climate Change.
Department for Transport, DECC, Defra, (2012). UK bioenergy strategy.
Dexheimer, R. Donald, (1985). Water-Source Heat Pump Handbook. National Water Well Association. Worthington, OH.
Ellis, Dan, (1989). Personal communication. President of the International Ground Source Heat Pump Association, Stillwater, OK and Vice President of Marketing, Water Furnace International, Inc., Ft. Wayne, IN.
HM Government, (2009). The UK Low Carbon Transition Plan.
HM Government, (2011). The Carbon Plan: Delivering Our Low Carbon Future.
HM Government, (2014a). The Green Deal, Energy Saving for Your Home.
HM Government, (2014b). Help From Your Energy Supplier: the Energy Company Obligation.
Jones, C; Kammen, D (2011). Quantifying Carbon Footprint Reduction Opportunities for U.S. Households and Communities. Environmental Science & Technology. 45 (9): 4088–4095.
Lund, John W., (1988). Geothermal Heat Pump Utilization in the United States. Geo-Heat Center Quarterly Bulletin, Vol. 11, No. 1 (summer), Klamath Falls, OR.
Science Buddies Staff. (2017). The Power of Heat Is Right Under Your Feet! .
Science Clarified. (2008). Geyser and Hot Spring.
The Geothermal Education Office. (2008). Facts and Information .
U.S. Department of Energy. (2006). Energy Efficiency and Renewable Energy: Geothermal Technologies Program.
Wright, L.; Kemp, S.; Williams, I. (2011). Carbon foot printing': towards a universally accepted definition. Carbon Management. 2 (1): 61–72.
